Note
Go to the end to download the full example code.
Benchmark problem: Wedged Plate - geometrically linear theory
Features
Using PatchMesher to model the plate
nodal boundary conditions using location-based search
face loads using location-based search
linear (small deformation) Triangle and Quad elements
history plot feature
import numpy as np
from femedu.examples import Example
from femedu.domain import System
from femedu.solver import NewtonRaphsonSolver, LinearSolver
from femedu.elements.linear import Quad, Triangle
from femedu.materials import PlaneStress
from femedu.mesher import *
class Example19_Benchmark01(Example):
def problem(self):
# ========== setting mesh parameters ==============
Nx = 8 # number of elements in the mesh
Ny = 4 # number of elements in the mesh
L1 = 48.0
L2 = 44.0
L3 = 16.0
# ========== setting material parameters ==============
params = dict(
E=1000., # Young's modulus
nu=0.3, # Poisson's ratio
t=1.00 # thickness of the plate
)
# ========== setting load parameters ==============
px = 0.0 # uniform load normal to x=Lx
pxy = 100.0 / L3 # uniform shear load on x=L1
# ========== setting analysis parameters ==============
USE_NONLINEAR_SOLVER = False # set to True if using an inelastic material
target_load_level = 5.00 # reference load
max_steps = 3 # number of load steps: 2 -> [0.0, 1.0]
#
# ==== Build the system model ====
#
model = System()
if USE_NONLINEAR_SOLVER:
model.setSolver(NewtonRaphsonSolver())
else:
model.setSolver(LinearSolver())
# create nodes
mesher = PatchMesher(model, (0., 0.), (L1, L2), (L1, L2 + L3), (0., L2))
nodes, elements = mesher.quadMesh(Nx, Ny, Quad, PlaneStress(params))
mesher.shift(1.25 * L1, 0.0)
nodes2, elements2 = mesher.triangleMesh(Nx, Ny, Triangle, PlaneStress(params))
nodes += nodes2
elements += elements2
# ==== Apply boundary conditions ====
#
# the left model
#
## fix left side
for node, _ in model.findNodesAlongLine((0.0, 0.0), (0.0, 1.0)):
node.fixDOF('ux', 'uy')
## define loads ...
for _, face in model.findFacesAlongLine((L1, 0.0), (0.0, 1.0), orientation=+1):
face.setLoad(px, pxy)
## locate the node at the centerline
nodeA, dist = model.findNodesAt((L1, L2 + L3))[0]
#
# the right model
#
## fix left side
for node, _ in model.findNodesAlongLine((1.25 * L1, 0.0), (0.0, 1.0)):
node.fixDOF('ux', 'uy')
## define loads ...
for _, face in model.findFacesAlongLine((2.25 * L1, 0.0), (0.0, 1.0), orientation=+1):
face.setLoad(px, pxy)
## locate the node at the centerline
nodeB, dist = model.findNodesAt((2.25 * L1, L2 + L3))[0]
# model.report()
# set up a recorder
model.initRecorder(variables=['ux', 'uy'], nodes=[nodeA, nodeB])
model.startRecorder()
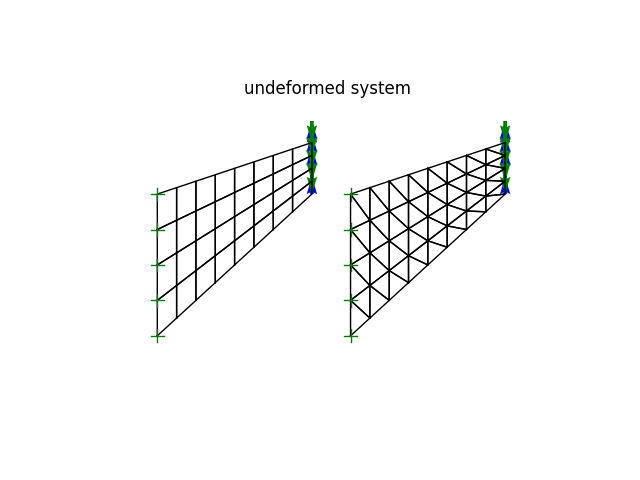
model.plot(factor=0, title="undeformed system", filename="benchmark01_undeformed.png", show_bc=1, show_loads=1)
for lf in np.linspace(0.0, target_load_level, max_steps+1):
model.setLoadFactor(lf)
model.solve(verbose=True)
# model.report()
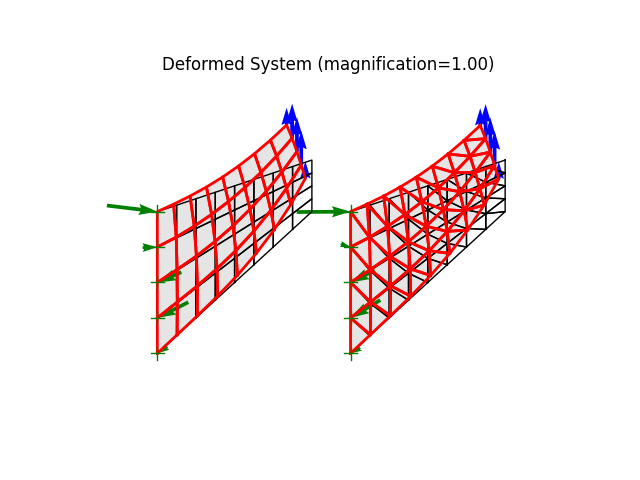
model.plot(factor=1., filename=f"benchmark01_deformed_lf{lf:.2f}.png", show_bc=1, show_loads=1,
show_reactions=1)
#
# model.valuePlot('ux', filename=f"benchmark01_ux_lf{lf:.2f}.png")
# model.valuePlot('uy', show_mesh=True, filename=f"benchmark01_uy_lf{lf:.2f}.png")
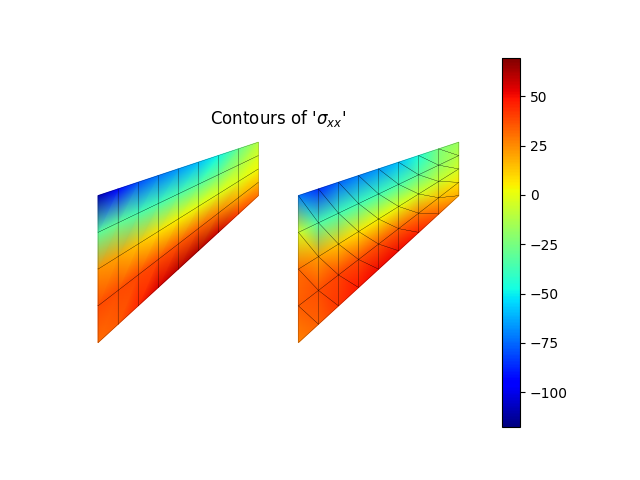
model.valuePlot('sxx', show_mesh=True)
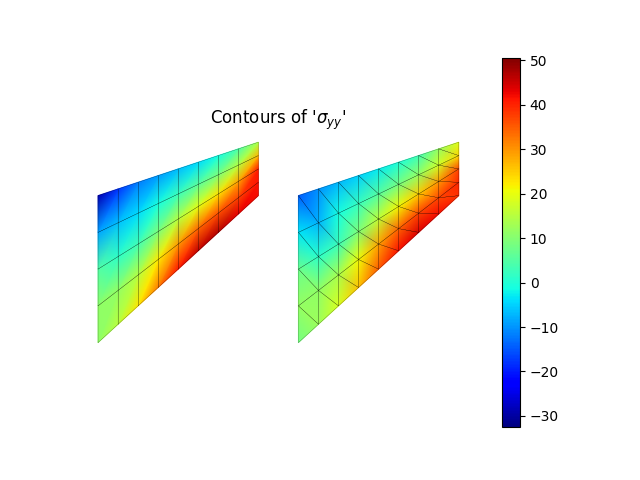
model.valuePlot('syy', show_mesh=True)
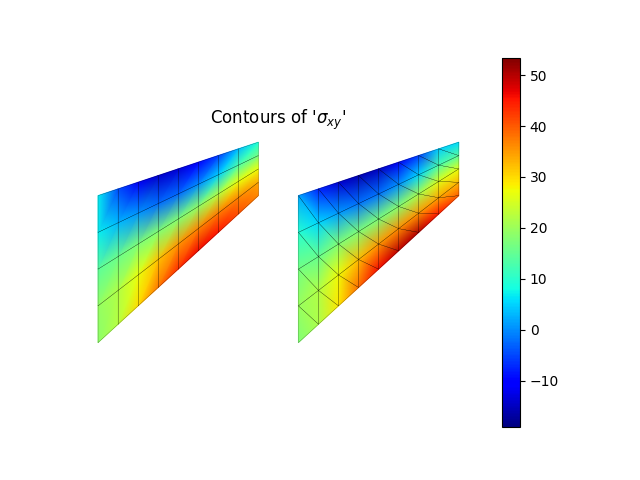
model.valuePlot('sxy', show_mesh=True)
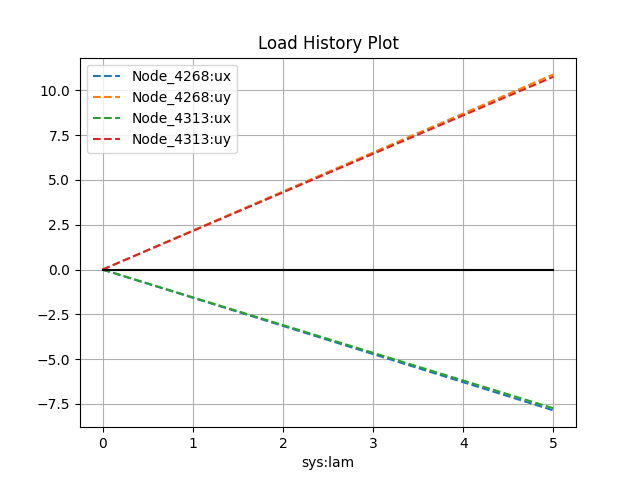
# create a history plot for the end node
# model.historyPlot('lam', ['ux','uy'], nodes=[nodeA,nodeA])
# model.historyPlot('lam', ['ux','uy'], nodes=[nodeB,nodeB])
model.historyPlot('lam', ['ux', 'uy', 'ux', 'uy'], nodes=[nodeA, nodeA, nodeB, nodeB])
Run the example by creating an instance of the problem and executing it by calling Example.run()
if __name__ == "__main__":
    ex = Example19_Benchmark01()
    ex.run()
Recorder.addData: 'stability' not initialized by the recorder: ignored
Recorder.addData: 'stability' not initialized by the recorder: ignored
Recorder.addData: 'stability' not initialized by the recorder: ignored
Recorder.addData: 'stability' not initialized by the recorder: ignored
Total running time of the script: (0 minutes 0.410 seconds)